
Cost control and performance
Why Cost Control Must Be an Operational Discipline
Short-term cost cutting can improve one quarter while weakening asset reliability over time. Sustainable control is different: a daily operating loop for commitments, variances, forecasts and unit cost.
Key findings
Costs are shaped by decisions before payment. By the time an invoice reaches accounting, much of its value has already been influenced by technology, scope, contracting strategy and schedule. Payment-stage control is necessary bookkeeping, but it is too late to be the primary management control.
The effect is asymmetric. In the illustrative $40m model, a 3% reduction in the cost base lifts EBITDA by 22.1%; an equivalent EBITDA increase from sales requires about 7.5% additional revenue at the modelled contribution margin.
Overrun is the industry norm. In EY's study of 365 projects, 64% exceeded budget and 73% missed schedule; average estimated completion cost came in 59% above the original figure. In the Middle East the share of projects facing overruns reached 89%.
The causes are mixed. EY identifies both internal and external drivers. Planning, estimating, contracting, governance and change control are manageable; regulation, geopolitics, currencies and labour conditions must be modelled and allocated.
Discipline is measurable and repeatable. Johan Sverdrup was delivered around 30% below its sanctioned budget through standardisation, an accelerated drilling programme and the reuse of proven solutions — not through cutting.
The price of weak control can extend beyond one project. Petrofac’s legacy contract losses, guarantee constraints and wider restructuring pressures culminated in administration of the listed holding company in 2025 and sales of principal businesses in 2026. The Thai Oil contract was material, but not the only disclosed factor.
An owner needs a panel of 10–12 indicators, reported weekly, anchored to commitments rather than payments, with explicit intervention triggers.
In every second conversation with the owner of a manufacturing or upstream business we hear the same sentence: "we need to cut costs by 15%." Almost always it reflects a feeling rather than a calculation — margins are compressing, working capital is getting heavier, the bank is asking uncomfortable questions. And almost always the proposed remedy is identical: freeze the budget, freeze hiring, defer maintenance, squeeze contractor rates.
The programme may work once. The following year it can reappear as deferred maintenance, loss of key engineers, contractor claims and a higher unit cost. This pattern is familiar across capital-intensive businesses; the mechanism is broadly the same even when the geography and asset differ.
Cost control is not a project and not a campaign. It is an operational discipline: a set of procedures embedded in daily work that operate regardless of whether the year is good or bad. What follows is why that holds financially, what the documented industry record shows, and what a working structure looks like — one an owner can implement and verify without external help.
01
Cutting versus controlling: two different operations
The distinction is not semantic. It is financial.
Cost cutting is a one-off action aimed at a line in the income statement. It reduces spend without changing how the obligation is created. Its effect therefore often fades as deferred work returns, sometimes at a premium.
Cost control is a standing procedure aimed at the mechanism by which commitment arises. It answers not "how much did we spend" but three other questions: what have we already committed to, does that match the approved scope, and what is the forecast at completion given current productivity.
| THE CORE DISTINCTION |
Why the industry record is so poor
EY's study "Spotlight on oil and gas megaprojects" covered 365 projects across upstream, LNG, pipelines and refining. The result: 64% of projects for which cost data was available were over budget, and 73% were behind schedule. Average estimated completion cost was 59% above the original estimate, and the aggregate cost of the sample rose from $1.2tn to $1.7tn. Even after final investment decision, when scope is supposedly fixed, 65% of projects showed overruns, with an average escalation of 23% against the sanctioned budget.
The regional breakdown matters for readers in the EU, the Middle East and the CIS, so we show it separately.
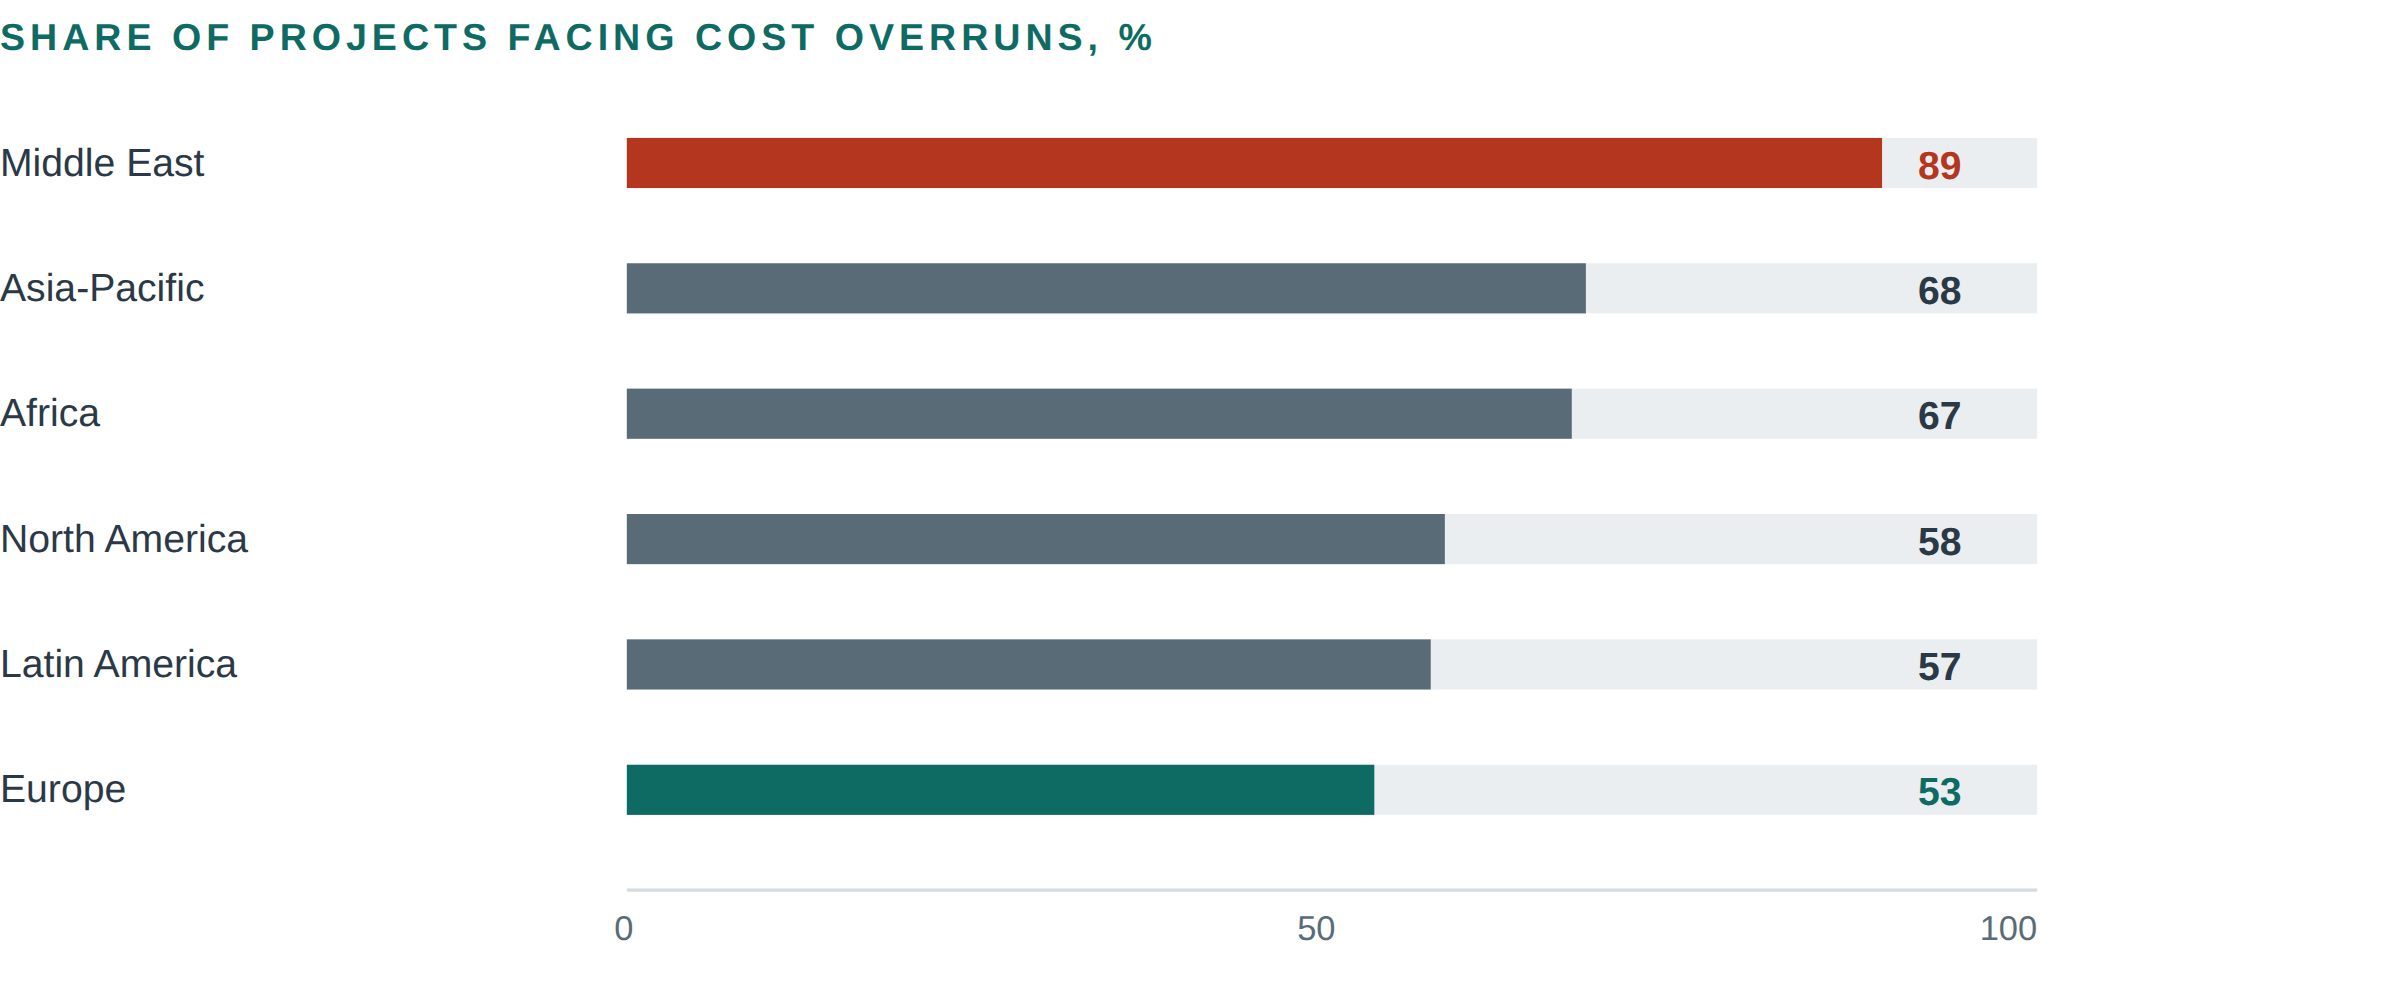
Figure 1. Share of projects encountering cost overruns, by region. Source: EY, "Spotlight on oil and gas megaprojects"; 365 projects above $1bn were reviewed, with cost data available for 205 projects [1][2]. This is a historical cross-sectional sample, not a forecast of current regional performance.
The interpretation matters. The 89% Middle East result does not, by itself, prove that projects there are inherently harder or that management quality is lower. EY identifies a mix of internal and external drivers, including planning, contracting, estimates, regulation, geopolitics, exchange rates and labour conditions. For an owner, geography is not a substitute for testing scope maturity, commercial structure and governance.
Many important drivers are manageable even when they are not fully controllable. Front-end definition, estimating discipline, contractor strategy, decision rights and change control sit within the owner’s influence; commodity prices, regulation and geopolitics require explicit scenarios and risk allocation.
02
The financial logic: where margin is actually created
In the illustrative model below, a 1% reduction in the cost base adds roughly 2.5 times as much EBITDA as a 1% increase in revenue, because only the contribution margin on additional sales reaches EBITDA. That relationship is model-specific, not a universal rule.
Model 1. Operating leverage in a mid-sized business
Take a notional energy-sector production and services company with $40m of revenue. The structure is typical for oilfield services, small-scale refining and industrial equipment manufacturing.
TABLE 1. EBITDA SENSITIVITY TO COST AND REVENUE, $M
| Line | Base | Costs −3% | Revenue −10% | Revenue −10% and costs −3% |
|---|---|---|---|---|
| Revenue | 40.00 | 40.00 | 36.00 | 36.00 |
| Variable production costs | 26.00 | 25.22 | 23.40 | 22.70 |
| Fixed production costs | 6.00 | 5.82 | 6.00 | 5.82 |
| SG&A | 3.20 | 3.10 | 3.20 | 3.10 |
| EBITDA | 4.80 | 5.86 | 3.40 | 4.38 |
| EBITDA margin | 12.0% | 14.6% | 9.4% | 12.2% |
| Change in EBITDA vs base | — | +22.1% | −29.2% | −8.8% |
| Revenue breakeven | 26.3 | 24.2 | 26.3 | 24.2 |
Table 1. Illustrative Consylion model. Variable costs move with volume; fixed costs do not. A 3% saving across the full cost base ($1.06m) lifts EBITDA by 22.1%. At the base contribution margin of 35%, the same $1.06m EBITDA increase would require about $3.02m of additional revenue, or 7.5% growth—not 22%. Figures are methodological illustrations, not forecasts.
Note the fourth scenario. A company that loses 10% of revenue by volume but keeps each cost line 3% below its corresponding level retains a slightly higher EBITDA margin than at the starting point, although absolute EBITDA remains lower. Discipline protects resilience; it does not make a downturn disappear.
Model 2. Unit economics: the only language worth using in upstream
In upstream and refining, absolute figures are useless without a denominator. The management conversation runs in dollars per barrel, per tonne, per cubic metre or per crew-hour. Below is a typical cash cost ladder for a mid-sized asset.
TABLE 2. CASH COST AND BREAKEVEN, $/BBL
| Item | Base | Lifting cost +20% | Management comment |
|---|---|---|---|
| Realised price | 68.00 | 68.00 | Not controllable |
| Royalty / production tax (20% of price) | (13.60) | (13.60) | Not controllable |
| Transport and logistics | (4.50) | (4.50) | Partly controllable (routing, parcel size) |
| Direct operating cost (lifting cost) | (14.00) | (16.80) | Fully controllable |
| G&A per barrel | (3.65) | (3.65) | Fully controllable |
| Cash margin before income tax | 32.25 | 29.45 | −8.7% |
| Sustaining capital expenditure | (12.00) | (12.00) | Controlled by decisions, not by payments |
| Free cash flow per barrel | 20.25 | 17.45 | −13.8% |
| Opex breakeven | 27.7 | 31.2 | Price at which the asset stops generating cash |
| Full-cycle breakeven | 42.7 | 46.2 | +3.5 $/bbl |
Table 2. Illustrative Consylion model. A 20% rise in direct operating cost — an increase service-cost inflation can deliver within a single contracting cycle — lifts the full-cycle breakeven by $3.5 per barrel. That is precisely the buffer separating an asset from shut-in during a price trough.
The practical conclusion we always put to owners: management reporting must be kept in unit terms and split into controllable versus non-controllable. A director accountable for $/bbl is running a business. A director accountable for "budget compliance" is running paperwork.
Model 3. The bridge from revenue to free cash flow
What an owner needs is not a P&L but a bridge: where exactly cash leaves the company, and how much of each step is manageable.
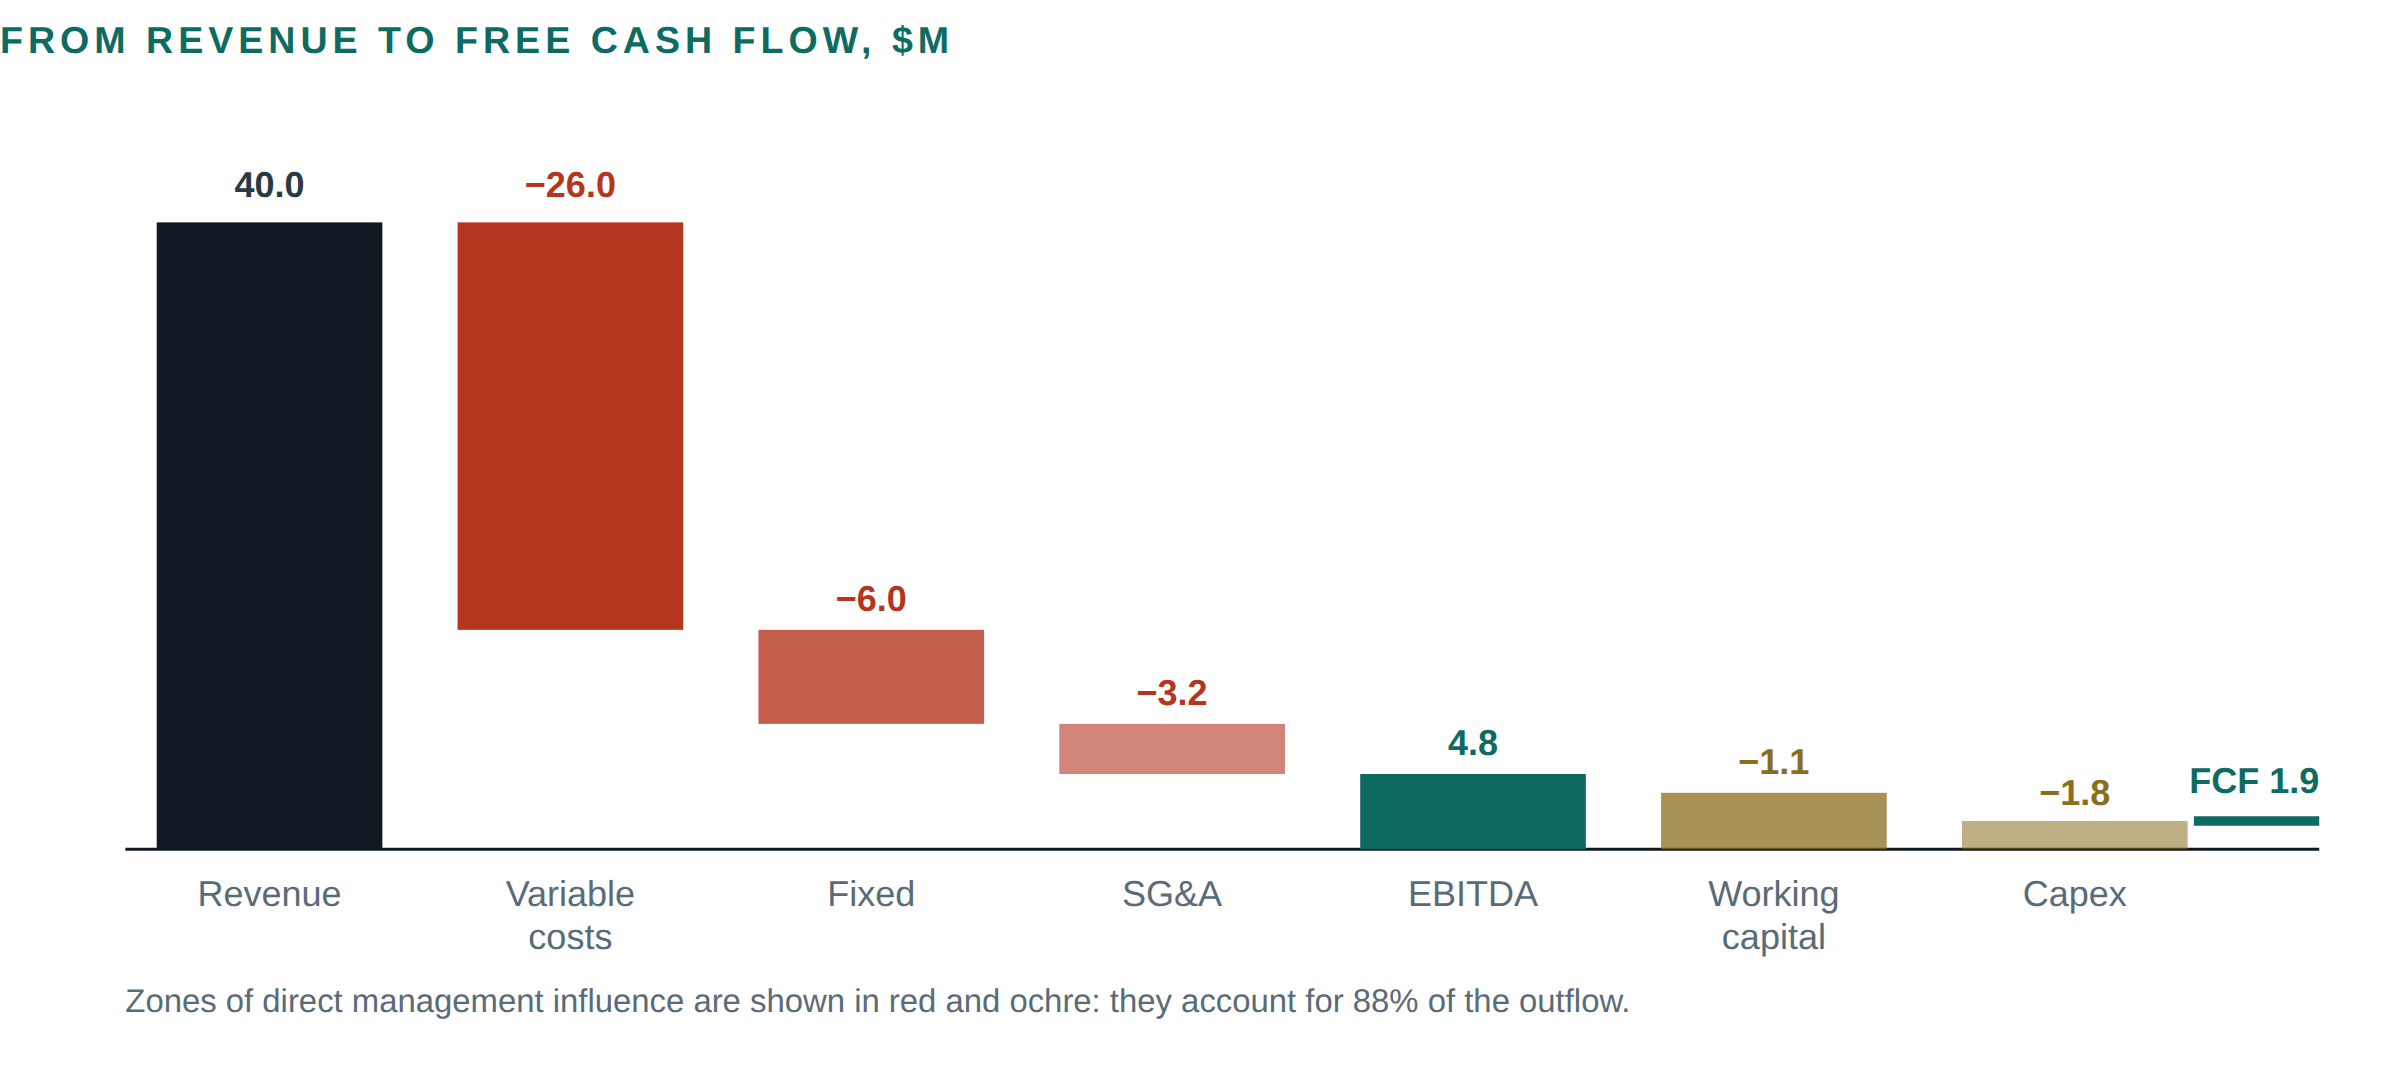
Figure 2. Bridge from revenue to free cash flow using the model in Table 1, with working capital and sustaining capex added. Illustrative Consylion model. Free cash flow equals 4.8% of revenue — a typical level for a mid-sized services or manufacturing business. On that structure, a 2% error in any large cost block consumes between a third and a half of annual FCF.
03
Architecture: four control loops
We work with a four-loop structure. It is deliberately simple: where an owner cannot resource all four, they must be implemented strictly in this order, because each one is useless without the one before it.
Loop 1. Commitment control (before spend)
This is the only loop that genuinely manages money. A commitment arises the moment an order, contract or variation is signed — not when it is paid. Between those two events lie anywhere from one to eighteen months, and throughout that period the company believes itself to be "on budget" while in fact it has already exceeded it.
Minimum working standard: a single commitment register; no spend without a pre-reserved budget; delegated authority limits tied to both value and risk type; mandatory finance review of any scope change before technical approval, not after.
Loop 2. Execution control
This loop compares physical progress with resources consumed. Earned value, through CPI and SPI, tests cost and schedule performance. VOWD captures work performed whether or not an invoice has arrived; comparing it with recorded invoices and accruals tests accounting completeness. These are different controls and should not be conflated.
Loop 3. Variance and corrective action
A variance without a named owner and a due date is a comment, not management. The standard we implement: every variance above a defined threshold receives an owner, a closure date, an assessment of its effect on forecast at completion, and a status reviewed weekly at the same meeting with the same attendees.
Loop 4. Knowledge control
A proprietary database of actual unit costs is an asset worth more than any ERP system. Without it, a company estimates each new facility from a blank sheet and systematically underestimates it. It was precisely the accumulated norms and the reuse of proven solutions that produced Equinor's result on Johan Sverdrup, discussed below.
TABLE 3. THE FOUR COST CONTROL LOOPS
| Loop | Management question | Instrument | Owner | Frequency |
|---|---|---|---|---|
| 1. Commitments | What have we already committed to, and was it authorised? | Commitment register; authority limits; budget reservation before signature | CFO | Continuous |
| 2. Execution | Does physical progress match the money spent? | VOWD; CPI/SPI; estimate at completion | Project / operations director | Weekly |
| 3. Variance | What went wrong, who is fixing it, by when? | Variance log with owner and date; scope change protocol | COO | Weekly |
| 4. Knowledge | Are we doing the same thing more cheaply than a year ago? | Unit cost database; benchmarking; design reuse standard | Owner / board | Quarterly |
Table 3. Implement strictly in sequence. Loop 2 without Loop 1 degenerates into reporting on the accomplished; Loop 4 without Loops 1–3 accumulates unreliable data.
Why that order: the influence curve
A classical observation of project economics: the ability to influence final cost is at its maximum when least has been spent, and falls to near zero by the time the bulk of the budget is being consumed. That is why control at the payment stage is meaningless.
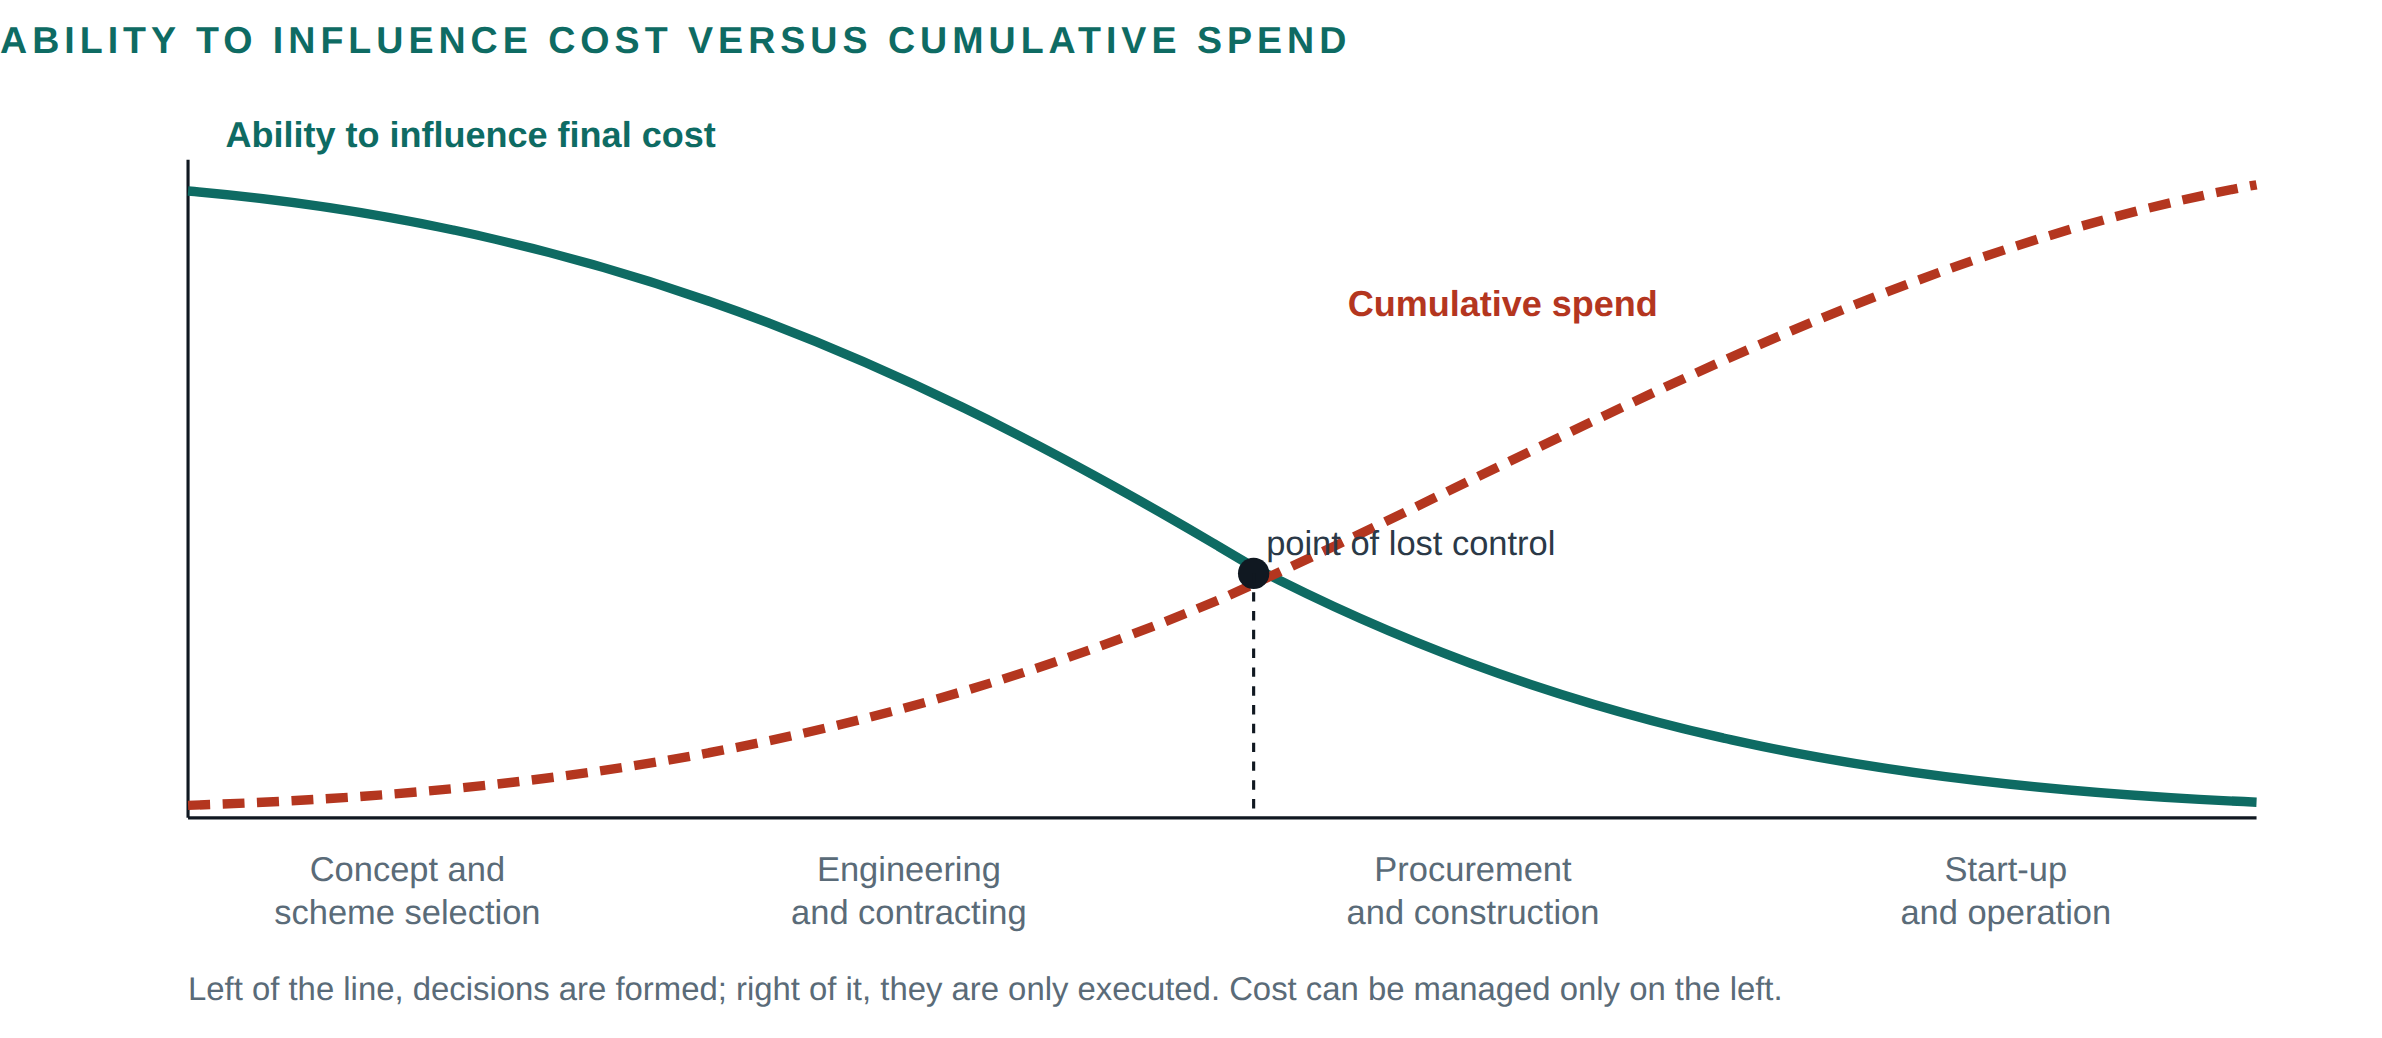
Figure 3. Schematic relationship underlying project cost control. The practical implication is not that late savings always destroy quality, but that options narrow as commitments accumulate. Early design and contracting decisions usually preserve more value than cuts imposed during construction.
Estimate maturity: why a budget approved on a guess is bound to fail
A separate and practical issue is the maturity of the estimate used for approval. AACE International RP 18R-97 classifies estimates by the maturity of project-definition deliverables—not by a headline percentage of design completion alone—and links each class to an intended use.
AACE estimate maturity: a practical reading
AACE distinguishes early screening and study estimates (Classes 5–4), budget/control estimates (Class 3), and control or bid/check estimates (Classes 2–1). Accuracy ranges are indicative, overlap and must be determined through project-specific risk analysis. An early estimate can support option screening, but it should not be presented as decision-grade precision merely by trimming the upper side of its uncertainty range [3][4]. The original AACE material is linked rather than reproduced because its licence restricts copying.
04
What the record shows
The cases below are publicly documented. We cite them not to point at others' mistakes, but because the mechanics that break a $40bn project break a $40m plant just as effectively. Only the scale of the consequences differs.
VALUE DESTRUCTION
Kashagan: when early assumptions prove incomplete
Discovered in 2000 and regarded at the time as the largest find in three decades. Start-up was originally planned for 2005 at a materially lower cost; first oil was achieved in September 2013, roughly eight years late and far above the original budget. Production then stopped after pipeline leaks linked to hydrogen-sulphide corrosion, requiring replacement of both lines. Public estimates put aggregate project spend at roughly $53–55bn, although scopes differ by source.
A separate issue is the dispute over cost recognition. Bloomberg reported in 2024 that Kazakhstan’s arbitration claims had risen above $150bn, including up to $138bn for alleged lost revenue. The figures were attributed partly to unnamed sources and should be read as reported claims, not adjudicated outcomes.
Management lesson: the public record supports the importance of testing environmental and execution assumptions before commitment. It does not establish the project’s exact AACE estimate class; describing a Class 4 estimate as having been used as Class 2 would be an unsupported inference.
VALUE DESTRUCTION
Gorgon LNG: a fixed plan meets changing conditions
At FID in 2009 the project was estimated at roughly $37bn. Public sources later cited estimates of about $52–54bn, with first LNG shipped in 2016. Reported drivers included labour cost pressure, currency effects and delay; the cited sources do not provide a single reconciled cost basis.
Management lesson: the public record establishes the overrun, but not that hedging or a decision-review mechanism was absent. The defensible conclusion is narrower: remote labour, currency, logistics and schedule risks need explicit allocation, contingency and periodic re-estimation.
VALUE DESTRUCTION
Tengiz (FGP-WPMP): successive revisions in a mature organisation
The Tengizchevroil expansion was sanctioned in 2016 at around $36.8–37bn. Public estimates subsequently rose to about $46.5bn in 2019, nearly $47bn in 2023 and roughly $48.5–49bn by 2024–2025. Production from the expansion started in January 2025, later than the original mid-2022 target.
Management lesson: operator experience does not remove execution risk. The public sources show repeated cost and schedule revisions, but they do not establish one root cause or prove that the project exceeded the organisation’s management capacity. The practical requirement is a current estimate at completion, transparent contingency logic and decision gates when the forecast changes.
VALUE DESTRUCTION
Petrofac: how contract losses and liquidity constraints compound
Petrofac, a major international contractor with a strong MENA position, was part of the consortium awarded the Thai Oil Clean Fuels EPC contract in 2018. For 2023 the group reported a $505m net loss, including an incremental loss of about $190m on that contract; year-end net debt was $583m and gross liquidity $201m. Petrofac also reported difficulty securing performance guarantees for new EPC work.
Thai Oil issued a termination notice in April 2025. After a proposed restructuring route failed amid wider pressures, Petrofac Limited entered administration and its London listing was cancelled in October 2025. Principal operating businesses were then sold, including Asset Solutions and Petrofac Emirates, in 2026.
Management lesson: a lump-sum EPC contract can concentrate cost-growth risk, but it would be inaccurate to attribute the whole corporate outcome to one contract. The broader warning is the interaction of legacy losses, portfolio concentration, liquidity, guarantees, creditor support and the ability to win new work.
VALUE CREATION
Johan Sverdrup: discipline as a source of 30% savings
The Phase 1 development plan was approved by the Norwegian parliament in August 2015 with a budget of around NOK 123bn. The estimate then fell successively: NOK 92bn, 88bn, 86bn and finally about NOK 83bn — some 30% below the starting level, a reduction of roughly NOK 40bn. Production began in October 2019, ahead of the originally announced date. The Phase 1 breakeven price fell below $20 per barrel.
The reasons cited publicly by the operator are specific and repeatable: standardisation of equipment packages, reuse of proven solutions, doing things right first time in partnership with suppliers, and an accelerated drilling programme — more wells were drilled than planned and more than a year ahead of schedule, which simultaneously cut cost and improved reservoir understanding.
Management lesson: none of these levers is "saving". All are engineering and organisational decisions taken before the main spending phase — that is, on the left of the influence curve. That is what cost control as a discipline looks like.
TABLE 4. CASE COMPARISON: WHAT WORKED AND WHAT DID NOT
| Project | Budget at sanction | Actual / current estimate | Variance | Root cause |
|---|---|---|---|---|
| Kashagan (Kazakhstan) | materially lower | ≈ $55bn | multiple | Public reporting indicates immature front-end assumptions; the exact AACE class is not established |
| Gorgon LNG (Australia) | $37bn | ≈ $54bn | +46% | Successive cost and schedule revisions; public sources do not establish absence of hedging or a review gate |
| Tengiz FGP-WPMP (Kazakhstan) | $36.8–37bn | ≈ $48.5bn | ≈ +31% | Successive estimate and schedule revisions; no single root cause is established in the cited public record |
| Petrofac / Thai Oil CFP | fixed price | $505m net loss (2023); holding company in administration (2025); principal businesses sold (2026) | restructuring / administration | Legacy contract losses, guarantee and liquidity constraints, and wider restructuring pressures |
| Johan Sverdrup, Phase 1 (Norway) | NOK 123bn | ≈ NOK 83bn | −30% | Standardisation, design reuse, accelerated drilling |
Table 4. Public-source data [5]–[16]. Amounts are presented as reported and may use different scopes, price bases and dates; they are therefore directional rather than strictly like-for-like.
05
The owner's indicator panel
An owner does not need a forty-page management report. They need 10–12 indicators that cannot be dressed up, and explicit thresholds at which they intervene personally.
TABLE 5. OWNER’S COST-CONTROL PANEL
| Indicator | Calculation | Target | Frequency | Intervention trigger |
|---|---|---|---|---|
| CPI — cost performance index | Earned value ÷ actual cost | ≥ 0.98 | Weekly | < 0.95 for two consecutive periods |
| SPI — schedule performance index | Earned value ÷ planned value | ≥ 0.95 | Weekly | < 0.90 |
| Commitment coverage | Contracted commitments ÷ approved budget | ≤ 100% | Continuous | > 95% at < 80% completion |
| Contingency drawdown | (Contingency used ÷ total contingency) ÷ (actual cost ÷ approved budget) | ≤ 1.0 | Monthly | > 1.2 |
| Change order ratio | Value of variations ÷ original contract value | ≤ 5% | Monthly | > 10% |
| Unit operating cost | $/bbl, $/t, $/MWh, $/crew-hour | trend ↓ | Monthly | Rising three months running |
| Breakeven | Price at which FCF = 0 | headroom ≥ 25% | Monthly | Headroom < 15% |
| Forecast accuracy | |forecast − actual| ÷ actual on closed periods | ≤ 5% | Quarterly | > 10% |
| Working capital cycle | DSO + DIO − DPO, days | sector norm | Monthly | Increase > 10 days per quarter |
| Covenant headroom | Net debt ÷ EBITDA against limit | headroom ≥ 0.5× | Monthly | Headroom < 0.25× |
| Cost per employee | Fully loaded people cost ÷ FTE | trend ↔︎ | Quarterly | Decoupling from output |
| Deferred maintenance | Value of postponed maintenance work | → 0 | Quarterly | > 10% of annual maintenance budget |
Table 5. The last line is easily underestimated. Deferred maintenance may not be visible in current-period profit, but it can become a hidden obligation and a source of later reliability loss.
06
Scenario analysis: calculate, do not assume
Discipline is not tested in the base case. Below is a stress test of the same company from Table 1 under three loads. We deliberately include a combined scenario: real crises arrive as a package, not one at a time.
TABLE 6. STRESS TEST, $M
| Parameter | S0 Base | S1 Price −15% | S2 Cost inflation +12% | S3 Combined | S3 + discipline |
|---|---|---|---|---|---|
| Revenue | 40.00 | 34.00 | 40.00 | 34.00 | 34.00 |
| Variable costs | 26.00 | 26.00 | 29.12 | 29.12 | 26.79 |
| Fixed costs | 6.00 | 6.00 | 6.72 | 6.72 | 6.18 |
| SG&A | 3.20 | 3.20 | 3.58 | 3.58 | 3.10 |
| EBITDA | 4.80 | (1.20) | 0.58 | (5.42) | (2.07) |
| EBITDA margin | 12.0% | −3.5% | 1.4% | −15.9% | −6.1% |
| Net debt / EBITDA (limit 3.0×) | 2.1× | n/m | n/m | n/m | n/m |
| Indicative runway from $6m buffer (EBITDA-only), months | > 24 | 60 | > 24 | 13 | 35 |
Table 6. Illustrative Consylion model. S3 combines a 15% price decline with 12% cost inflation and produces an EBITDA loss of $5.42m. "S3 + discipline" assumes that pre-installed Loops 1–3 limit inflation in variable and fixed costs to 3% and reduce SG&A by 3%, improving EBITDA by $3.35m. Using a $6m cash buffer and EBITDA loss alone as a simplified burn proxy, the indicative runway rises from about 13 to 35 months. This is not a liquidity forecast: capital expenditure, working capital, interest, tax, covenants and minimum cash requirements are excluded.
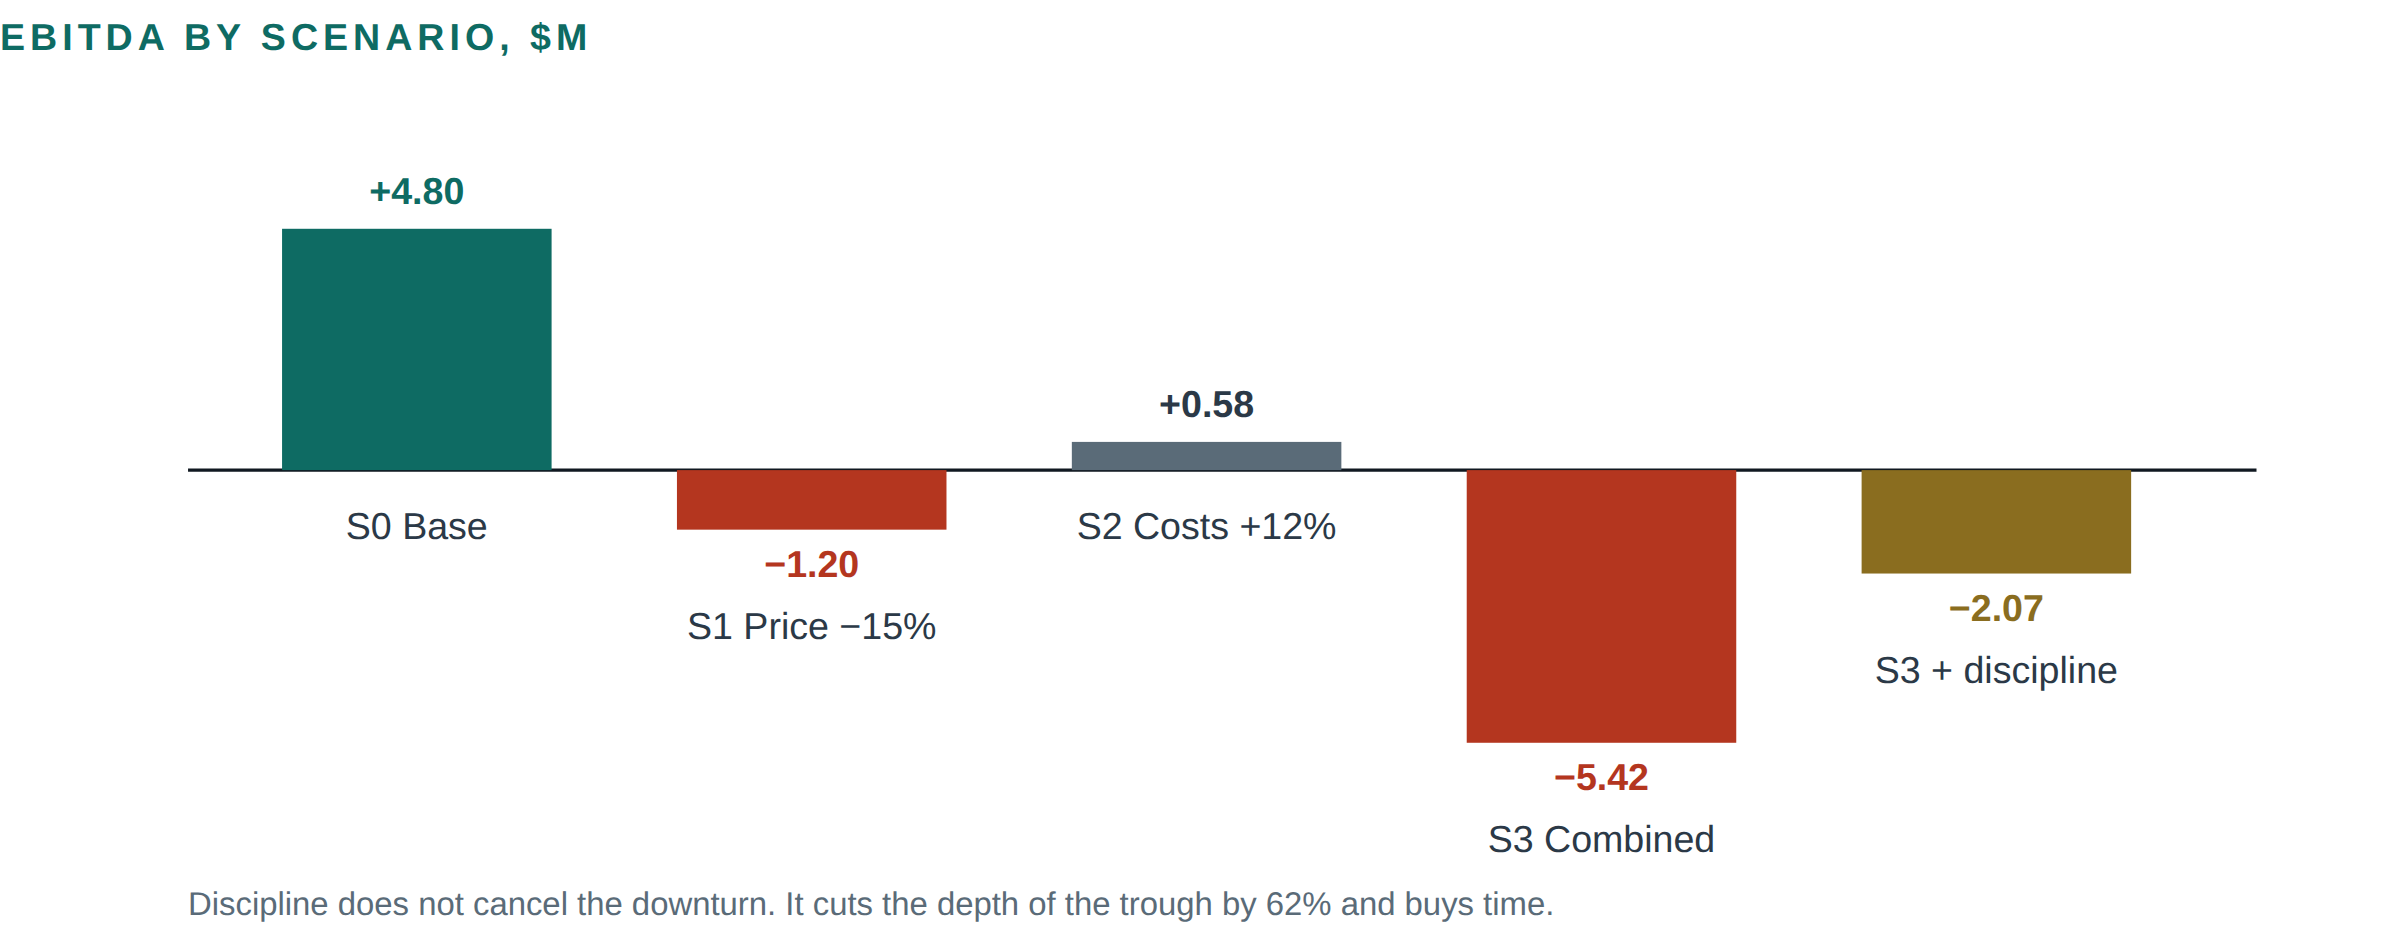
Figure 4. Result of the stress test in Table 7. The difference between the fourth and fifth columns is the value of the management system, expressed in money. It is precisely what an owner cannot see in a calm year.
07
Implementation risks and how they present
TABLE 7. IMPLEMENTATION RISK MATRIX
| Risk | Likelihood | Impact | Early indicator | Mitigation |
|---|---|---|---|---|
| Discipline is replaced by reporting | High | High | Reports multiply, decisions do not change | Every meeting closes with a decision, an owner and a date; a report without a decision is not accepted |
| Maintenance is cut instead of controlled | High | Critical | Rising share of breakdown work | Maintenance budget ring-fenced; deferred work logged as a commitment |
| Loss of key specialists | Medium | High | Lengthening time to fill vacancies | Payroll reduction is not a first-choice instrument |
| Contractors squeezed below their cost | Medium | High | Rising claims and variations | Should-cost estimate before tender; abnormally low bids rejected as policy |
| Manipulation of estimate at completion | Medium | High | Stable EAC against a falling SPI | Independent EAC review quarterly; reconciliation against the actuals database |
| Deploying an IT system instead of a procedure | High | Medium | An "ERP implementation" with no documented processes | Procedure and owners first, automation second |
| Middle-management resistance | High | Medium | Data supplied late | Bonuses linked to CPI and forecast accuracy, not to "staying within budget" |
Table 7. The first row is a common cause of failure. A healthier system produces more decisions and closed actions, not simply more reports.
08
A 90-day programme
A programme an owner can launch without an external consultant and verify on formal evidence.
Days 1–30. Visibility
Build a single commitment register: every signed contract, order and variation, with value, date and status. Typically 10–20% of commitments turn out not to be reflected in the budget.
Recalculate unit costs for the past 24 months by facility and work type.
Fix the authority matrix: who may sign for what amount, by category of spend.
Define the controllable and non-controllable cost lists, with a named owner for each line.
Days 31–60. Control
Prohibit any commitment without a pre-reserved budget. The only exception is emergency work, documented retrospectively within 48 hours.
Introduce a weekly variance meeting: fixed attendees, fixed time, agenda drawn from the variance log.
Begin tracking VOWD on every project above a defined threshold.
Make finance review of scope changes mandatory before technical approval.
Days 61–90. Forecasting and incentives
Build an estimate at completion for every project and reconcile it against the approved budget.
Run the three-scenario stress test and calculate the liquidity horizon in each.
Rebuild the bonus scheme: reward forecast accuracy and CPI rather than "not exceeding budget" — the latter incentivises inflating the budget at the outset.
Launch the actual unit cost database with a mandatory update after each facility closes out.
09
Conclusion
We built this article around numbers rather than principles deliberately, because the principles of cost control are universally known and almost never applied. The gap between knowing and doing is filled by discipline — procedures that operate when no one is watching.
Three propositions we regard as practically proven, and on which we base our client work.
First. Cost control is the management of commitments, not of expenses. A company that sees only paid invoices manages the past. A company that sees signed but unpaid commitments manages the future. Between those two states lies the entire difference between Kashagan and Johan Sverdrup, and it is organisational rather than technological.
Second. Discipline costs less than its absence, and the comparison can be modelled. For a $40m-revenue company, an internal planning assumption of 0.5–0.8% of revenue implies an annual control-system cost of $0.20–0.32m; this is an illustrative range, not an external benchmark. In the stress test, discipline improves EBITDA by $3.35m and extends the simplified EBITDA-only runway from about 13 to 35 months. The implied benefit-to-cost multiple is roughly 10–17× before implementation risk and omitted cash items. The cost is visible every year; the avoided loss becomes visible mainly in a downturn.
Third. Cutting and controlling are opposite operations, and confusing them is dangerous. Cutting reduces spend while preserving the mechanism that generates it; it withdraws value from the asset and presents the bill two to three years later. Control changes the mechanism; it creates value and makes it repeatable. An owner who demands "a 15% cut" gets the first. An owner who demands "show me unit cost by facility, the commitment register and the estimate at completion" gets the second.
| WHAT TO DO THIS WEEK |
A final observation for small and mid-sized businesses. Petrofac shows how legacy contract losses, a weakened balance sheet, limited access to performance guarantees and broader restructuring pressures can reinforce one another. The Thai Oil contract was a material contributor, but the public record does not support describing it as the sole cause. Petrofac Limited entered administration in October 2025; principal operating businesses were subsequently sold under new ownership in 2026. For an owner, the lesson is portfolio concentration and liquidity resilience—not a claim that one contract alone explains the whole outcome.
References
EY. Oil and gas megaproject overruns to cost industry more than US$500b. Press release, 14 August 2014. PR Newswire
EY. Spotlight on oil and gas megaprojects. Archived report copy; reviewed 365 projects. PDF
AACE International. RP 18R-97 sample: Cost Estimate Classification System for the Process Industries. 7 August 2020. AACE
AACE International. Professional Guidance Document No. 01: Guide to Cost Estimate Classification Systems. AACE Library
RFE/RL. Kazakhstan’s Kashagan Starts Up… Again. 13 October 2016. RFE/RL
Bloomberg. Kazakhstan’s Compensation Claims Against Kashagan Oil Firms Jump to $150 Billion. 17 April 2024; subscriber article based partly on unnamed sources. Bloomberg
Parliament of Australia, Senate Hansard. Gorgon cost discussion. 3 September 2014. aph.gov.au
Chevron Australia. Gorgon Project: official project overview. Chevron
Wood Mackenzie. Tengiz expansion report summary. 6 November 2019. Wood Mackenzie
World Oil / Bloomberg. Tengiz cost estimate rises by $1.5bn. 14 March 2024. World Oil
S&P Global Commodity Insights. Tengiz expansion starts production; reported project cost about $49bn. 24 January 2025. S&P Global
Petrofac. Results for the year ended 31 December 2023. 31 May 2024. Petrofac
Petrofac. Balance Sheet Restructuring Prospectus, including Thai Oil termination notice. 29 April 2025. Petrofac PDF
Petrofac. Cancellation of listing following appointment of administrators. 28 October 2025. Petrofac
Petrofac. Completion of sale of Petrofac Emirates. 26 May 2026. Petrofac
Equinor. Johan Sverdrup, the North Sea giant, is on stream. 5 October 2019. Equinor
Sources were checked on 26 July 2026. Project amounts are reported figures with differing scopes and price bases; some sources are paywalled or provide only a public summary. Links and facts may change after publication.
Legal notice and disclaimer
Informational purpose. This material was prepared by Consylion for information and education only. It is not investment, financial, tax, accounting, legal, technical or other professional advice and must not be the sole basis for a management or investment decision. Reading it does not create a client, advisory or fiduciary relationship.
No offer. Nothing here constitutes an offer, an invitation to make an offer, or a recommendation to enter into any transaction in securities, equity interests, commodities or derivatives, nor does it constitute the promotion of financial products.
Calculations and models. All financial models, tables and scenarios described as illustrative are simplified methodological examples built on assumed inputs. They do not reflect the results of any specific company, are not forecasts, and guarantee no outcome. Actual results may differ materially.
Sources and accuracy. Project and company information is drawn from the public sources listed above, with a data cut-off of 26 July 2026. Consylion has not independently verified every third-party statement and gives no representation or warranty as to completeness, accuracy or continued currency. The material may become outdated; Consylion undertakes no duty to update it.
Third-party references. Company names, project names and trade marks are used solely for fair informational and analytical comment on publicly available facts. Such references imply no association, affiliation, endorsement or sponsorship, and assert nothing beyond what is disclosed in the cited sources. All trade marks belong to their respective owners.
Limitation of liability. To the fullest extent permitted by applicable law, Consylion, its personnel and affiliates accept no liability for loss arising from reliance on this material. Nothing here excludes liability that cannot lawfully be excluded. Readers should obtain advice based on their specific facts and jurisdiction.
Corrections and copyright. Factual correction requests may be sent to info@consylion.com. © 2026 Consylion FZ-LLC. All rights reserved. Brief quotations are permitted with clear attribution and an active link to the original Consylion publication. Full or substantial reproduction, translation or commercial reuse requires prior written consent.